What’s in Your Google Drive? Find Out with Spanning Stats for Google Drive
 Two days ago Google launched Google Drive. Yesterday we saw the volume of files uploaded to Google Drive (née Google Docs) increase by a factor of 10. People are uploading a bunch of stuff—but what? What’s in your Google Drive?
As it turns out, that’s a tough question to answer. Well, it was until just now.
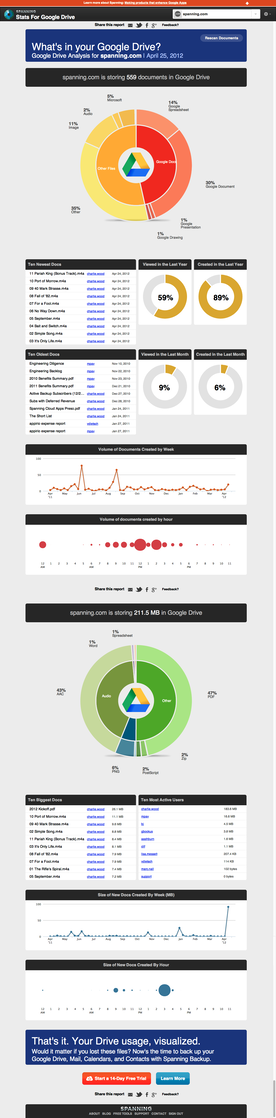
Spanning Stats for Google Drive is now available, and it’s free. To get a customized visual report of exactly how you’re using Google Drive (like the one shown here) just visit freetools.spanningbyemc.wpengine.com/#stats and click “Sign In”. Or if you’re a Google Workspace domain administrator, click “Add to Google Workspace” and you’ll be able to see a report for your whole domain and each user in it.
Either way, you’ll see a complete report showing:
- percentage of docs in your Google Drive by type
- top 10 newest and oldest files
- percentage of your files were created and viewed in the last month and year
- volume of documents created per week over the last year
- volume of documents created by hour throughout the day
- how much quota you’re consuming by file type
- the 10 files consuming the most quota
- the 10 users consuming the most quota (domain admins only)
- size of files uploaded per week over the last year
- size of files uploaded by hour throughout the day
You can share your report privately or publicly, and can disable sharing at any time. You can view the domain-wide report for spanningbyemc.wpengine.com here.
We invite you to check it out, run a report, and let us know how you’re using Google Drive.